The UK's most powerful residential data platform

Revolutionising property decisions through data
Revolutionising property decisions through data


Datasets including demographics, planning, policies and more
Report types and data tools
900+
77+
GET ACCESS

Datapoints per property on average
Of all sales and rental listings and transactions in the UK with historical comparables.
800+
99%


Choose the right plan for your business


REalyse Basic
Land & Ownership

API
Use our raw data proprietary datasets, in your business, however you see fit
Custom
Individual platform setup for your purposes

REalyse Lite
Land & Ownership
Industry-leading solution. Ideal for individual use and small businesses


Planning - 5 Years Data

Policies

Comparables - 2 Years Data

Markets

Points of interest

Demographics data

Own account manager
Limited Saved Projects

Limited PNG & CSV exports

Planning - 2 Years Data
Policies
Comparables - 6 Months Data
Same as Lite but with extended year data ranges and requests pool
Markets
Points of interest
Demographics data

Limited Saved Projects
Customer support, Webinars Sessions
Limited PNG exports
£1800
/Annually (+20% VAT)
£150
/monthly (+20% VAT)
REalyse Enterprise
Land & Ownership


Planning
Policies
Comparables
Markets
Points of interest
Demographics data
Own account manager

No limits on clicks and reports
API usage possible

Priority license

Unlimited Access to all of our data for Enterprise Customers

BTR Data

Student Accommodation Data

Up to 20 site cards

£1188
/Annually (+20% VAT)
£110
/monthly (+20% VAT)
Unlimited site cards to the Site Board
Leave contacts
The manager will contact you within 15 minutes
Leave contacts
The manager will contact you within 15 minutes


Visualise market information and compare across locations
Markets
Create bespoke time series trends
Visualise the data using our heat mapping technology


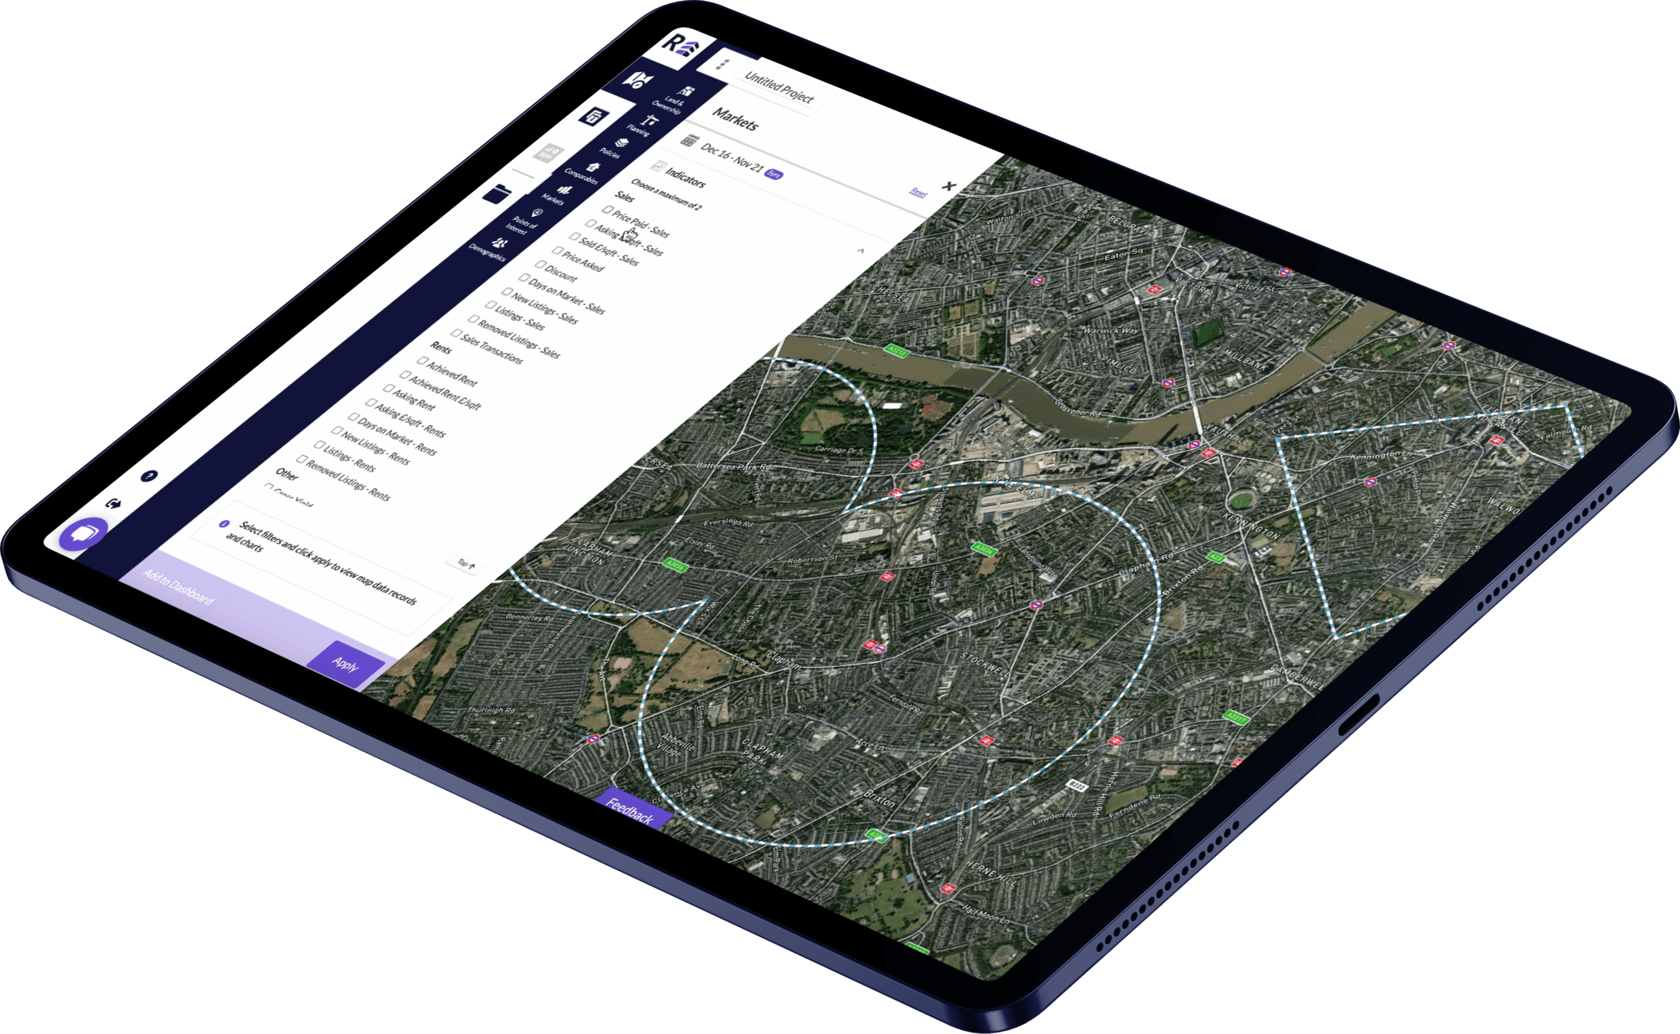
The Markets feature is a powerful tool to easily compare multiple locations and data sets at once. It gives you the ability to visualise any of our market information as a time series which you can benchmark against the regional or national average, plus you can add in the quartiles too.
Sales: Price Paid, Asking £/sqft, Sold £/sqft, Price Asked, Discount, Days on Market, New Listings, Total Listings, Removed Listings, Sales Transactions.
Our market data:


Rants: Achieved Rent, Achieved Rent £/sqft, Asking Rent, Asking Rent £/sqft, Days on Market, New Listings, Total Listings.
Other: Gross Yield, Property Size.


Comparables
Source property listings data for sales or rents
Source all property transaction records
Filter your searches and export


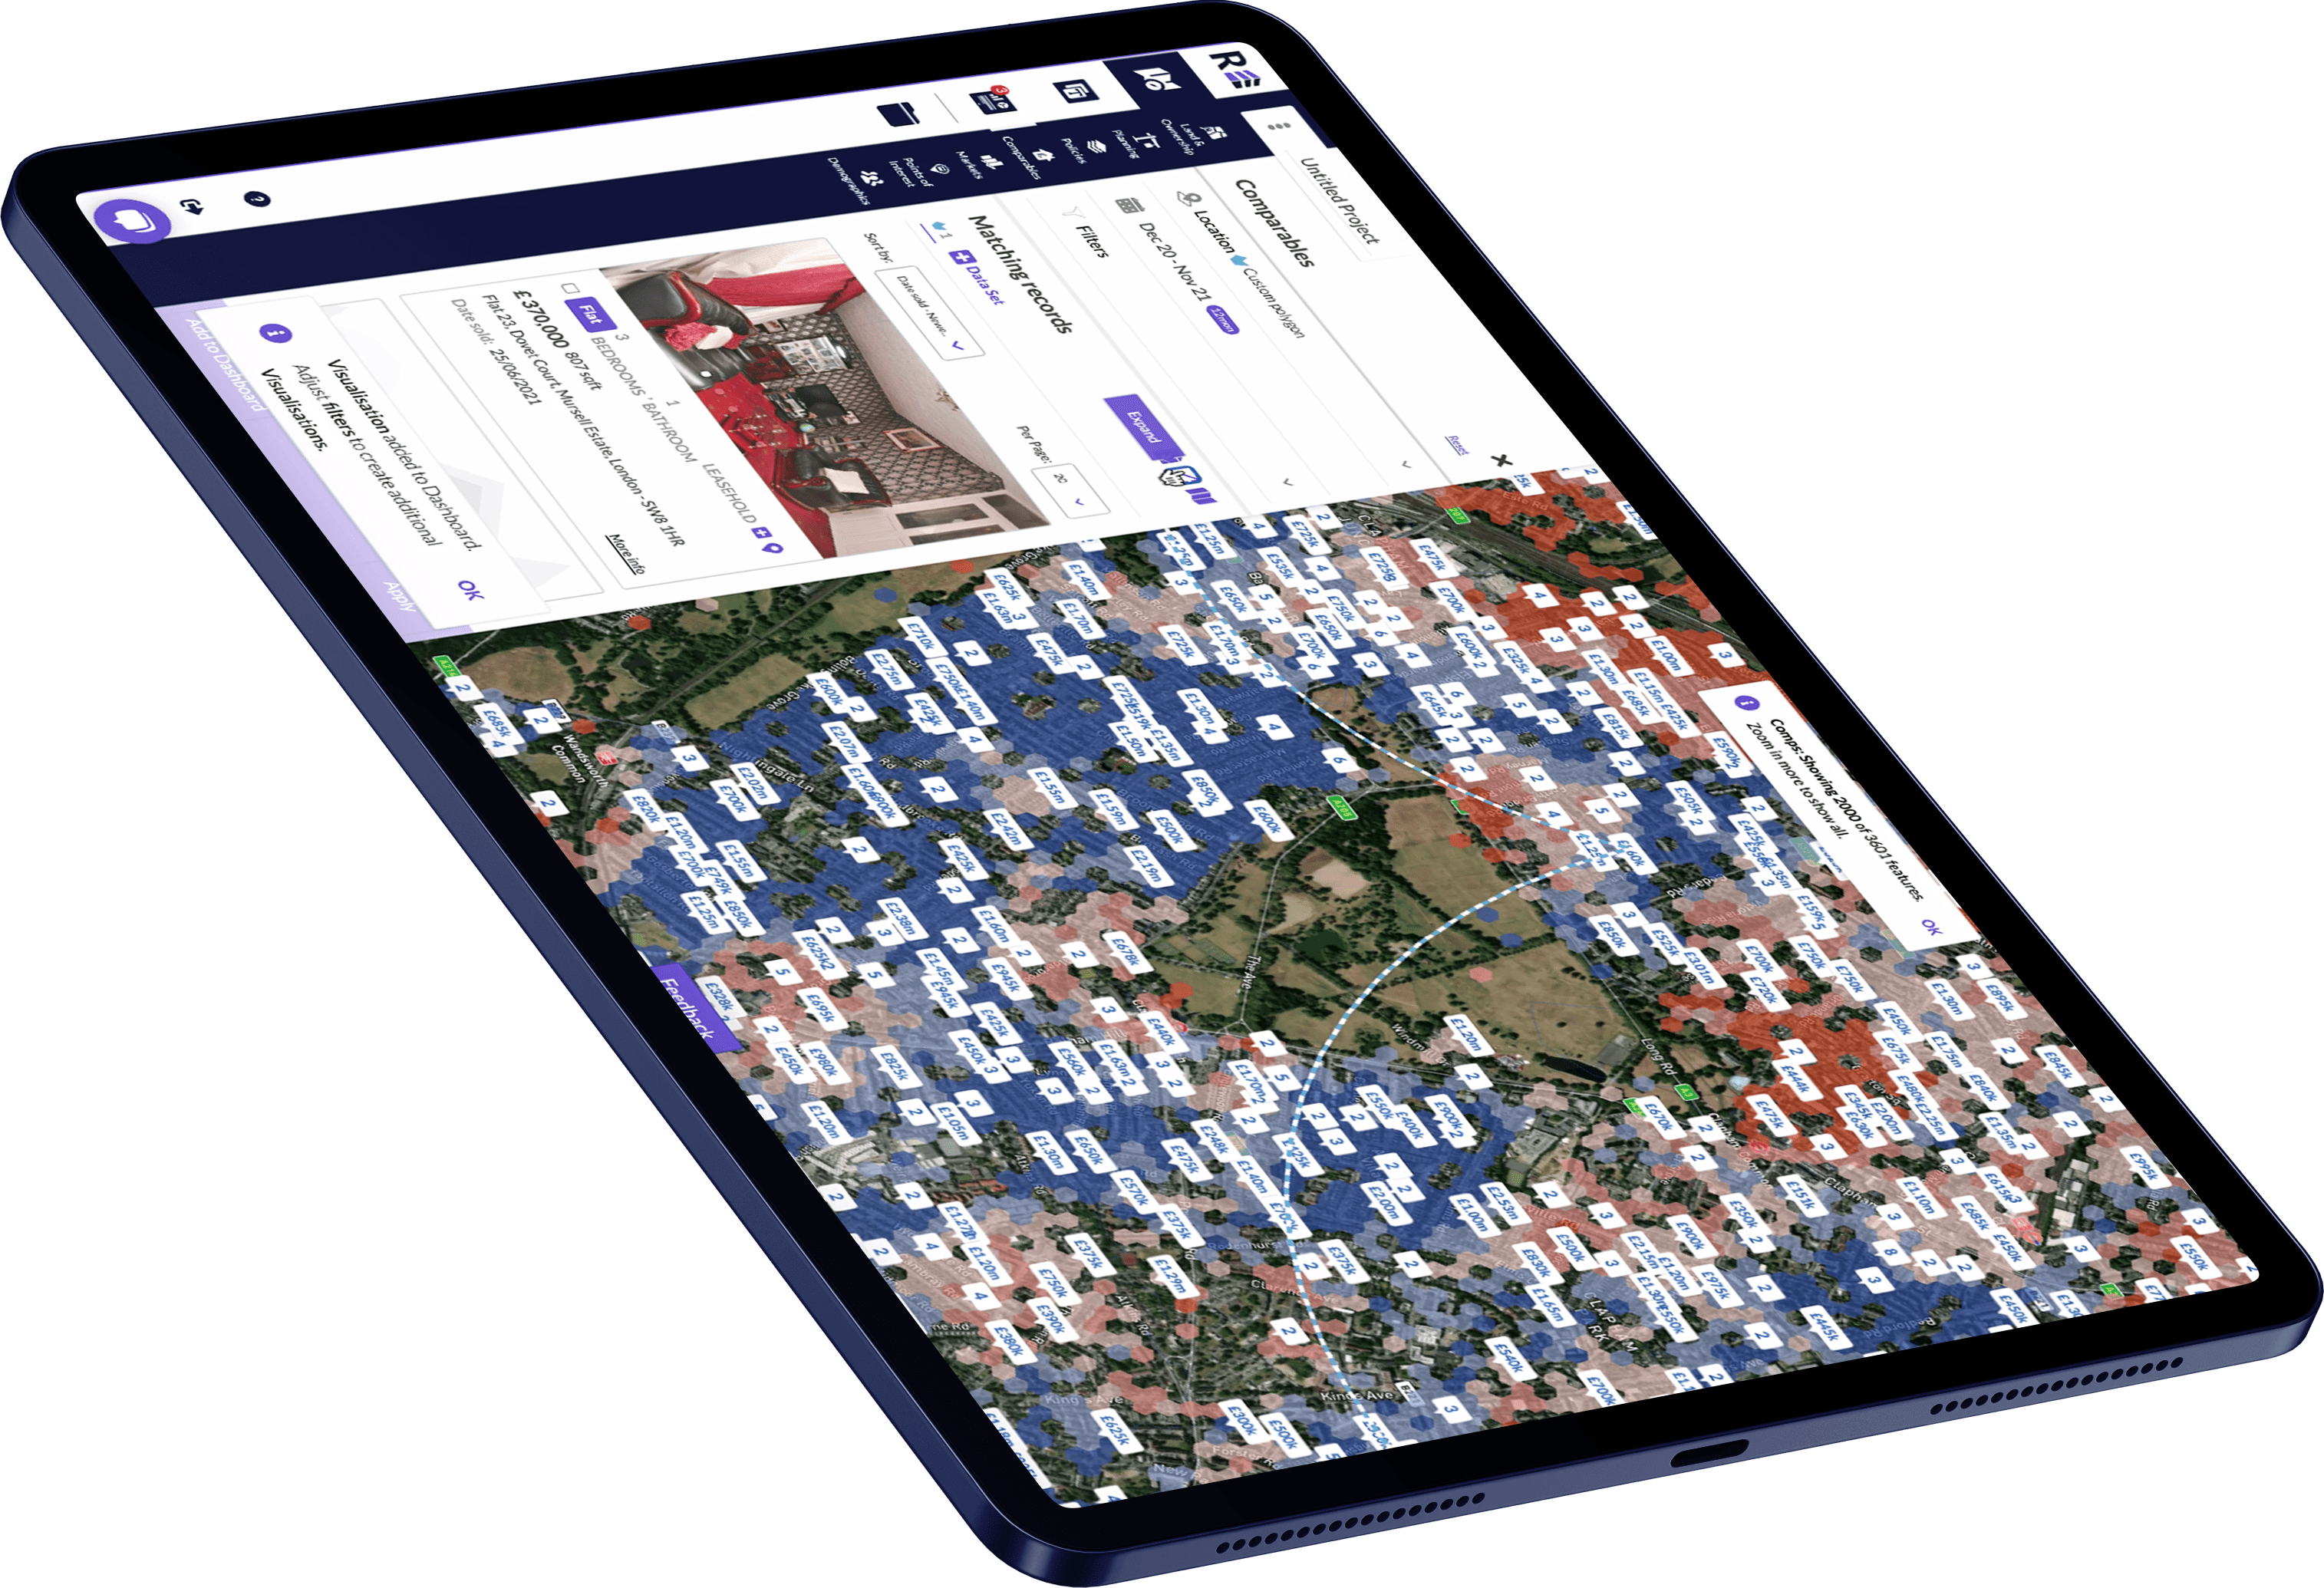
The Comparable feature gives you the ability to find every sales transaction from the Land Registry throughout England and Wales plus every rental or sales listing. Using data science we're able to get a high level of detail for the sales transactions including floor plans, photos, days on market, estimated yield, and £/sqft.
You can filter your searches by bedroom numbers, build type (new build
or secondary stock), number of bedrooms, and by features such having
outside space, parking or a swimming pool, for a bungalow or even
student accommodation.
or secondary stock), number of bedrooms, and by features such having
outside space, parking or a swimming pool, for a bungalow or even
student accommodation.
You can then export the data to CSV should you wish to do your own in depth analysis or simply save them to a project folder.
You can filter your searches
by bedroom numbers, build type
(new build or secondary stock), number of bedrooms, and by features such having outside space, parking
or a swimming pool, for a bungalow
or even student accommodation.
by bedroom numbers, build type
(new build or secondary stock), number of bedrooms, and by features such having outside space, parking
or a swimming pool, for a bungalow
or even student accommodation.


Land Ownership
Understand the ownership of any plot of land
Search for land that suits your development needs
Bespoke planning feature


The Land Ownership Feature is the ideal tool to quickly find out who owns
a plot of land and the leaseholds within it. From a land finding perspective you can easily search any given area of the UK for plots of land that meet your search criteria. These can be quickly saved into a project folder or exported to CSV.
a plot of land and the leaseholds within it. From a land finding perspective you can easily search any given area of the UK for plots of land that meet your search criteria. These can be quickly saved into a project folder or exported to CSV.
Once you have identified a plot of land, you can then overlay the Planning Feature to find out what planning applications may be associated to it.


Planning & Policy
Gather details for all planning applications
Quickly assess the planning pipeline
Combine policy information with your planning searches


Our Planning Feature provide a concise view into every planning application throughout the UK visualised on the map. You could simply use the feature to find out who is getting an extension down your road, or if you work for
an investment, development, or lending company, easily source new deals. If you need to find out what the planning or construction pipeline is like,
our graphs allow you to see this in an instant.
an investment, development, or lending company, easily source new deals. If you need to find out what the planning or construction pipeline is like,
our graphs allow you to see this in an instant.
The information shown on the map can be filtered down by development type, planning status, planning stage, construction status, contract stage, primary categories (student accommodation, elderly living,
hotels, private housing etc), project sectors, and purely Build-To-Rent
hotels, private housing etc), project sectors, and purely Build-To-Rent
There is a huge amount of detail provided in each application such as the scheme details, who the client is (and the architect, planning consultant, project manager etc), number of units, start and end date of construction, plus so much more.
Our policy overlays give you the ability to overlay any bit of policy information such as SHLAA data, TPO's, brownfield sites, conservation areas, listed buildings, AONB and plenty more.
Our Planning Feature provide a concise view into every planning application throughout the UK visualised on the map. You could simply use the feature to find out who is getting an extension down your road, or if you work for
an investment, development, or lending company, easily source new deals. If you need to find out what
the planning or construction pipeline
is like, our graphs allow you to see
this in an instant.
an investment, development, or lending company, easily source new deals. If you need to find out what
the planning or construction pipeline
is like, our graphs allow you to see
this in an instant.


The Demographics feature allows you to quickly draw a location and find out the total population, population by age (broken down to individual ages and how many there are), median age, population density, dwellings, rent
vs sales, population education, income by age, unemployment level and crime statistics.
vs sales, population education, income by age, unemployment level and crime statistics.
From a point of view of finding an area that meets your development criteria, you can visualise the information as a heat map giving you the ability to identify where your target market is depending on age and the income that a particular age bracket is earning.


The Point of Interest feature is perfect for instantly finding out what amenities are in the an area. You can filter your search by Transport (National Rail
or Underground, Tram and Metro), Schools (primary and infant, secondary, independent), Eating and Drinking (pubs, bars, inns, restaurants),
and Supermarket chains.
or Underground, Tram and Metro), Schools (primary and infant, secondary, independent), Eating and Drinking (pubs, bars, inns, restaurants),
and Supermarket chains.


Do you always need to run the same report over and over again? It's is pretty time consuming and frustrating (we know!). Using our Custom Report Feature you can set up as many templated reports as you wish, with every bit of data you need such as property comparables, market data time series, planning information, map views for everything, there is no limit to their complexity
or simplicity.
or simplicity.
All you need to do is draw or select a location, choose which of your templates you wish to use, and then export it Word.
Do you always need to run the same report over and over again? It's is pretty time consuming and frustrating (we know!). Using our Custom Report Feature you can set up as many templated reports as you wish, with every bit of data you need such as property comparables, market data time series, planning information, map views for everything, there is no limit
to their complexity or simplicity.
to their complexity or simplicity.

Key features:


Explore

With Explore all can quickly access and analyse every relevant dataset. See land, market and demographic data, planning and construction activity, policies, amenities and comparables, on charts, lists and on a map – from neighbourhood detail to the whole of the UK.
Dashboard
Dashboards let you collect different charts, maps and records together, in any arrangement you like. Edit searches and data, and see data visualised in the ways that suit you best. You can collect data that interests you, or use templates to instantly create a detailed report for a specific research task.
Land Search
Land search lets you find and filter land plots by criteria like acreage, site coverage and ownership type. See planning applications and construction on site and nearby, see what policies apply, and overlay heat maps of market and demographic data. Create a shortlist, and to know more about a site, use templates to create a detailed report.
Main Map
The REalyse main map is the most powerful tool available to analyse property markets, from individual properties, to the whole of the UK. Unique data visualisations let you see any combination of market, demographic, policy, comparable, land, planning, construction and amenity data.
Templates
Templates let you instantly create
a detailed interactive digital report. Standard templates are available to all, and we can create customised templates tailored specifically to your workflows, due diligence and research requirements. This one feature can cut routine and regular research tasks from hours to minutes.
a detailed interactive digital report. Standard templates are available to all, and we can create customised templates tailored specifically to your workflows, due diligence and research requirements. This one feature can cut routine and regular research tasks from hours to minutes.
Export
Export lets you turn a dashboard into a fully editable, designed word document, which can be shared with your team or form the basis of credit and investment documents. Choose what you want to include, and whether you want to see records as summary tables or in full detail, with full photography for comperables.

Unprecedented Insights: Using cutting edge data science, we bring together all UK residential data set into one place. Enabling you to make the right decision, faster.
Visualise: The powerful analytics tools and industry-first heat-mapping make it easy to interpret the data, and instant reporting lets you create detailed dashboards tailored to your (or your teams) individual workflows in seconds.
Proprietary Datasets: With over 100 data sources spanning planning and policy, land information, achieved rents, market data and detailed comparables, demographics and so much more, we aim to revolutionise real estate through unlocking insights and trends.


About us


What our clients say

Managing Director, Pinnacle Investments
“This has literally revolutionised the due dilligence process”

Development Manager, Morgan Sindall Investments

Investment Surveyor, Cushman & Wakefield
“We always have a consistent view across the team”
“A brilliant tool that brings transparency to markets”
Christopher Turnbull
Rebecca Lewis
Ted Harding
Our data sources


What our clients say


Managing Director, Pinnacle Investments
“This has literally revolutionised the due dilligence process”
Development Manager, Morgan Sindall Investments
Investment Surveyor, Cushman & Wakefield
“We always have a consistent view across the team”
“A brilliant tool that brings transparency to markets”
Christopher Turnbull
Rebecca Lewis
Ted Harding
Our Investors


Company
Legal
Copyright @ 2024 Treex All rights reserved
Contact


